yann
April 16, 2024, 2:52pm
1
Hello, (using 6.1.1 on Windows 10)
I have a figure containing subplots. Now I would like to add a second y axis to one of the plots, while the other keeps just one. I managed to do it with only one plot in the figure, but havent been able to figure out how it works with subplot or if this is possible at all in scilab.
Hello,
Welcome to this forum ! Do you have a small example to illustrate your problem/need ?(use code blocks to insert code see https://scilab.discourse.group/t/welcome-to-the-scilab-discourse-forum ).
S.
yann
April 18, 2024, 7:24am
3
Hi Stéphane,
// Preparing example data
x  = linspace(1,10,100);
y1 = sin(x);
y2 = exp(x/6).*(sin(x)+1.5);
y3 = x*2+50;

fig = scf(1)
clf
// plot data
subplot(211)

plot2d(x, y1)

// second subplot with two y-axes
subplot(212)
c1 = color("blue");
c2 = color("red");

plot2d(x, y2, style=c1)

// set up second y-axis
ax2 = newaxes();
set(ax2, "filled", "off", "foreground", c2, "font_color", c2);

plot2d(x,y3,style=c2);

ax2.axes_visible(1) = "off";
ax2.y_location = "right";
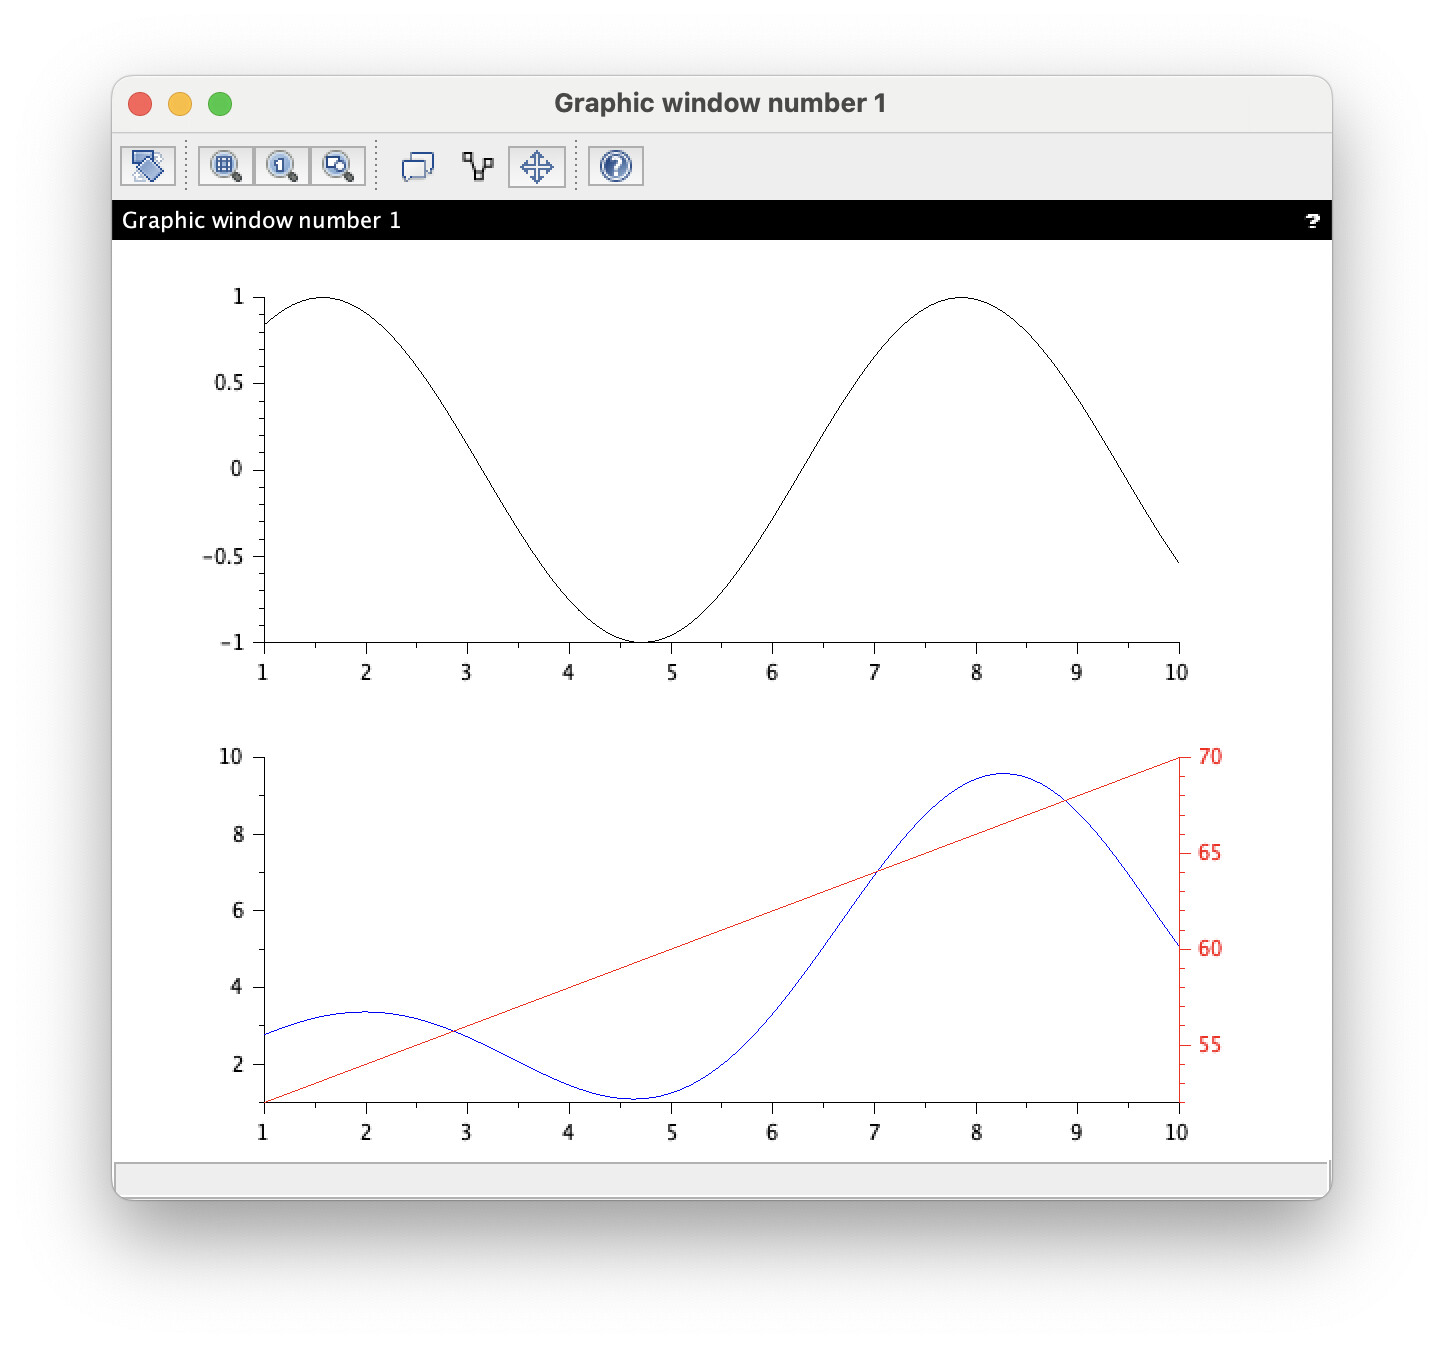
To me it looks like that newaxes() is ignoring subplot() and so far I could not a find a way, to move the right y-axis to the lower subplot.
I hope that this explains my problem more clearly.
Y.
Hello,
I would propose the following fix in order to copy the current axes bounds to the new axes:
// set up second y-axis
b = gca().axes_bounds;
ax2 = newaxes();
ax2.axes_bounds = b;
set(ax2, "filled", "off", "foreground", c2, "font_color", c2);
yann
April 22, 2024, 2:05pm
5
Hi,
thank you so much for your solution. It did fix my issue.