Can someone tell me please how do I plot 2D graphic of “y = x^2 + 2x + 1” with range of x = -10 to x = 10? Thank you
Hello,
You can have a look to the examples in the documentation at plot - 2D plot
Thank you so much for your reply. I still don’t understand when learning from the link you posted. I need to learn by example. Please anyone that could answer my question in my first post.
x = linspace(-10,10, 20);
y = x.^2 + 2*x + 1;
plot(x,y);
Can you tell me please what “20” mean in “x = linspace(-10,10, 20);”? Thanks
shortly …
linspace
generates linearly spaced numbers between 2 reached bounds
n
integer number of requested values or columns. Default value: 100
Details in this link
Hello,
Typing
help linspace
should give you the explanation you asked for.
S.
type:
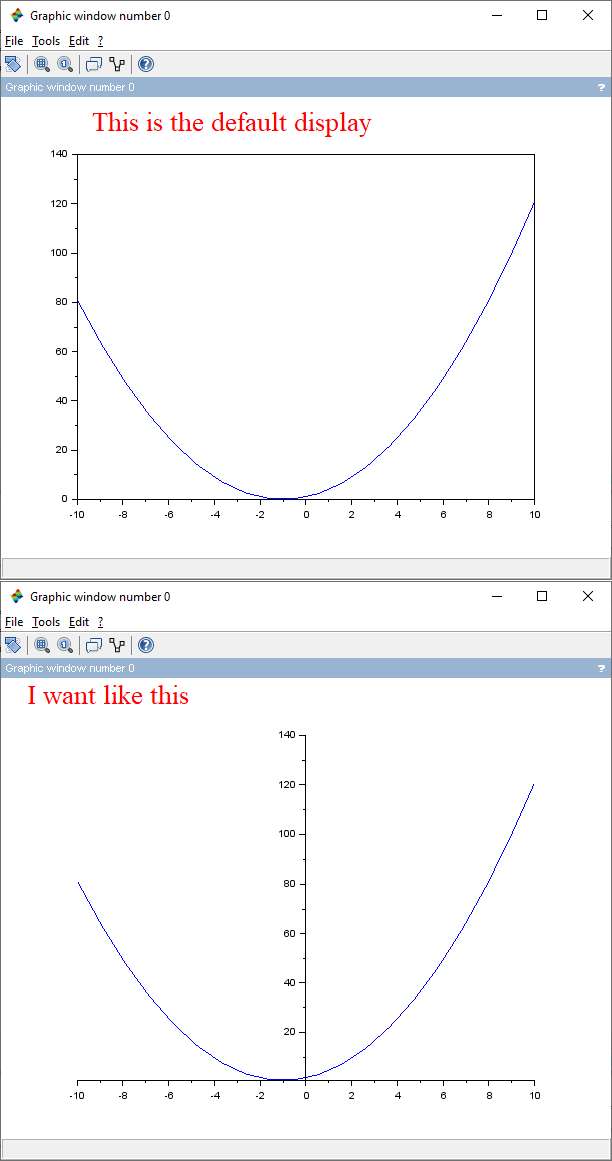
gca().y_location="origin"
if you have negative y values you can also add
gca().x_location="origin"
It says “invalid factor”.

I still have the error. What should I do?

scyscy, please tell us which Scilab version you are using, and on which platform/OS.
Thanks
I am using Windows 10 and Scilab 5.5.0
Scilab 5.5.0 was released nine years ago and in this version recursive assignment was not possible. If you still want to use this version, you should write:
a=gca();
a.y_location="origin"
or
set(gca(), "y_location","origin")
If you don’t have any reason to still use this obsolete version, you should download and install the latest version (Scilab 2024.0.0 | Scilab ).
S.
Hello,
When I copy/paste this code into Scilab 6.1.1, 2023.0, 2023.1, and 2024.0 I get the expected plot without any error.
S.

How to show the -y axis?
Hello, you have the answer here:
What about in scilab 5.5.0? I use below code but it doesn’t works:
a=gca();
a.y_location="origin"
or
set(gca(), "y_location","origin")
If you don’t have negative x-data the y axis won’t show up, even after setting the y_location Axes property. To force the axis display, you have to change the Axes limits, like in the following code:
t=1:10;
plot(t,sin(t));
a=gca();
a.x_location="origin";
a.y_location="origin";
a.box="off"

a.data_bounds(1)=-1;
